
Once you experience something, you can never really shake that truth from your reality.
It sticks with you.
It attaches to your life experience.
The box that is your perception and your reality widen and new truths are unlocked.
This chart below was the one that shattered my perception.
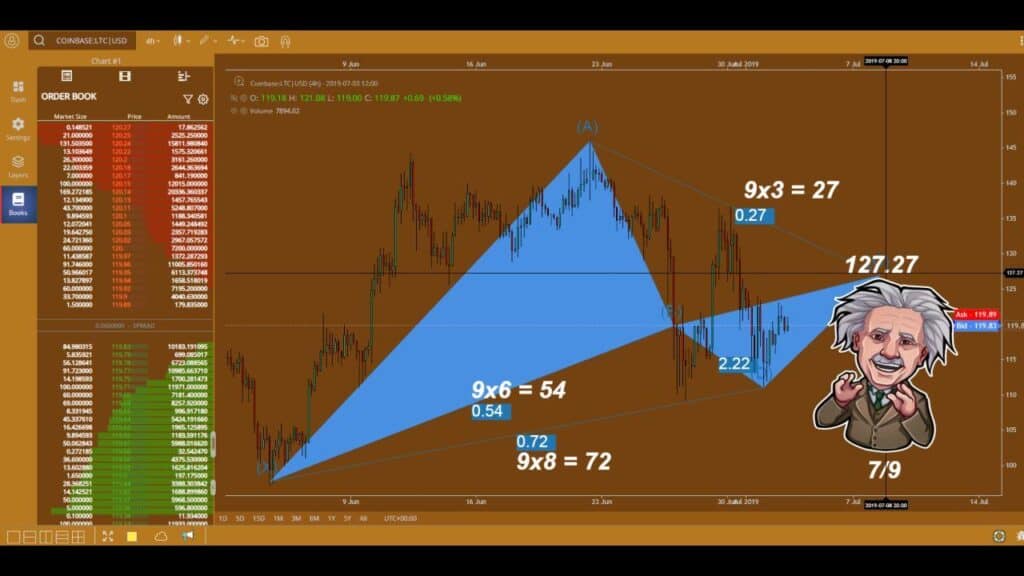
CandleboxAI Backhanding Chart
At the time I was discouraged about holding bags from 2017.
Did phenomenally well on the bull run.
What I was not prepared for was the bear market that was to come.
I knew that people made money in bear markets…
That is where I needed to be but I had to find someone that has.
I need an unbiased view so I wouldn’t be caught up in the hype like that ever again.
What got me in this mess, to begin with, was following a guy that was a permabull and there was no correction coming.
That was a painful sheepish experience.
Yes, it was an expensive trading lesson too… you remember that euphoric feeling and that is when it is time to exit the ship.
My quest to find that person lead to me running across CandleboxAI on Twitter.
He used Gann, ciphers, and math to project targets.
This in itself was something I had never seen before.
I was instantly fascinated and yet taken aback.
I was taught markets are unpredictable…
I also read books that said you are better off leaving your money in the stock market through the dips and not trying to time it…

He said Litecoin would hit $127.27 on or before 7/9/2019 based on the 4hr chart you saw above.
I didn’t believe it would happen but thought his method of reaching this conclusion was pretty interesting.
This really caught my attention.
Back then he used ciphers a lot, and the foundation was on the numbers generated.
These numbers were based on how the cipher was laid.
It was a mathematical relationship or harmonic for a given point of price to move.
That got me thinking very deeply… Look at the simple math on the chart.
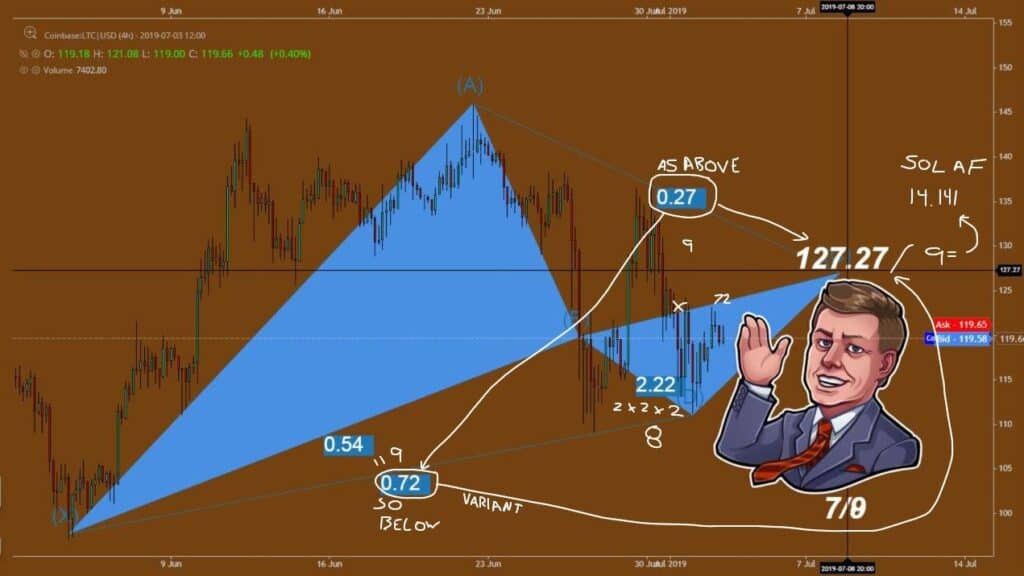
I immediately made notes on what I saw.
As above, so below… 0.72 was below and 0.27 was above…
9 appeared to be the common denominator
The target divided by 9 was a SOL variant!
Take the yearly low at the time of 22 and divide by 7… Pi
Could this simple math really work?
I then thought about the price being unpredictable…
You can’t time the markets…
Have I been lied to this whole time?
How is it these investment gurus have a job in finance if everything is unpredictable?
What is the one thing in life that has NOT lied to you?
Math
It is constant and by the way the target hit.
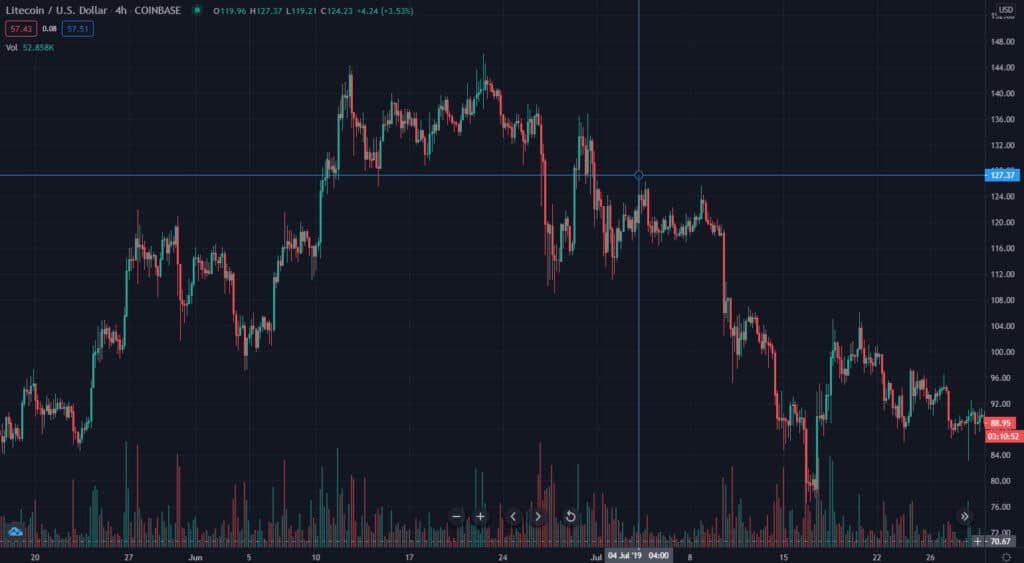
This blew my mind.
Still wowed by that moment.
Things have never been seen the same since.
Everything changes.
Your perspective, your conviction, your beliefs… It all morphs to a new truth unlocked.
I know this is one example, but if you go through CandleboxAI’s charts this is far from the only one…
It was the one that got me and made me a believer.
I know this might have been a little long, but I felt it was important to share the story of my breakthrough.
Everyone has a different lens that they see the world through and maybe this has helped you.
I sincerely hope you find that moment, that chart, that ah-ha idea that opens your perception to a new view.
Ciphers and sol variants .. what are these ?
It’s inspiring but nothing teachable in this article. Other than the nice story is there anything I can learn from this article ?
Take a look here: https://www.youtube.com/watch?v=iQTbbipNdzA