
Evolution of the Chart
I will attach as much proof as I can, but it’s there for you to see… from start to target.
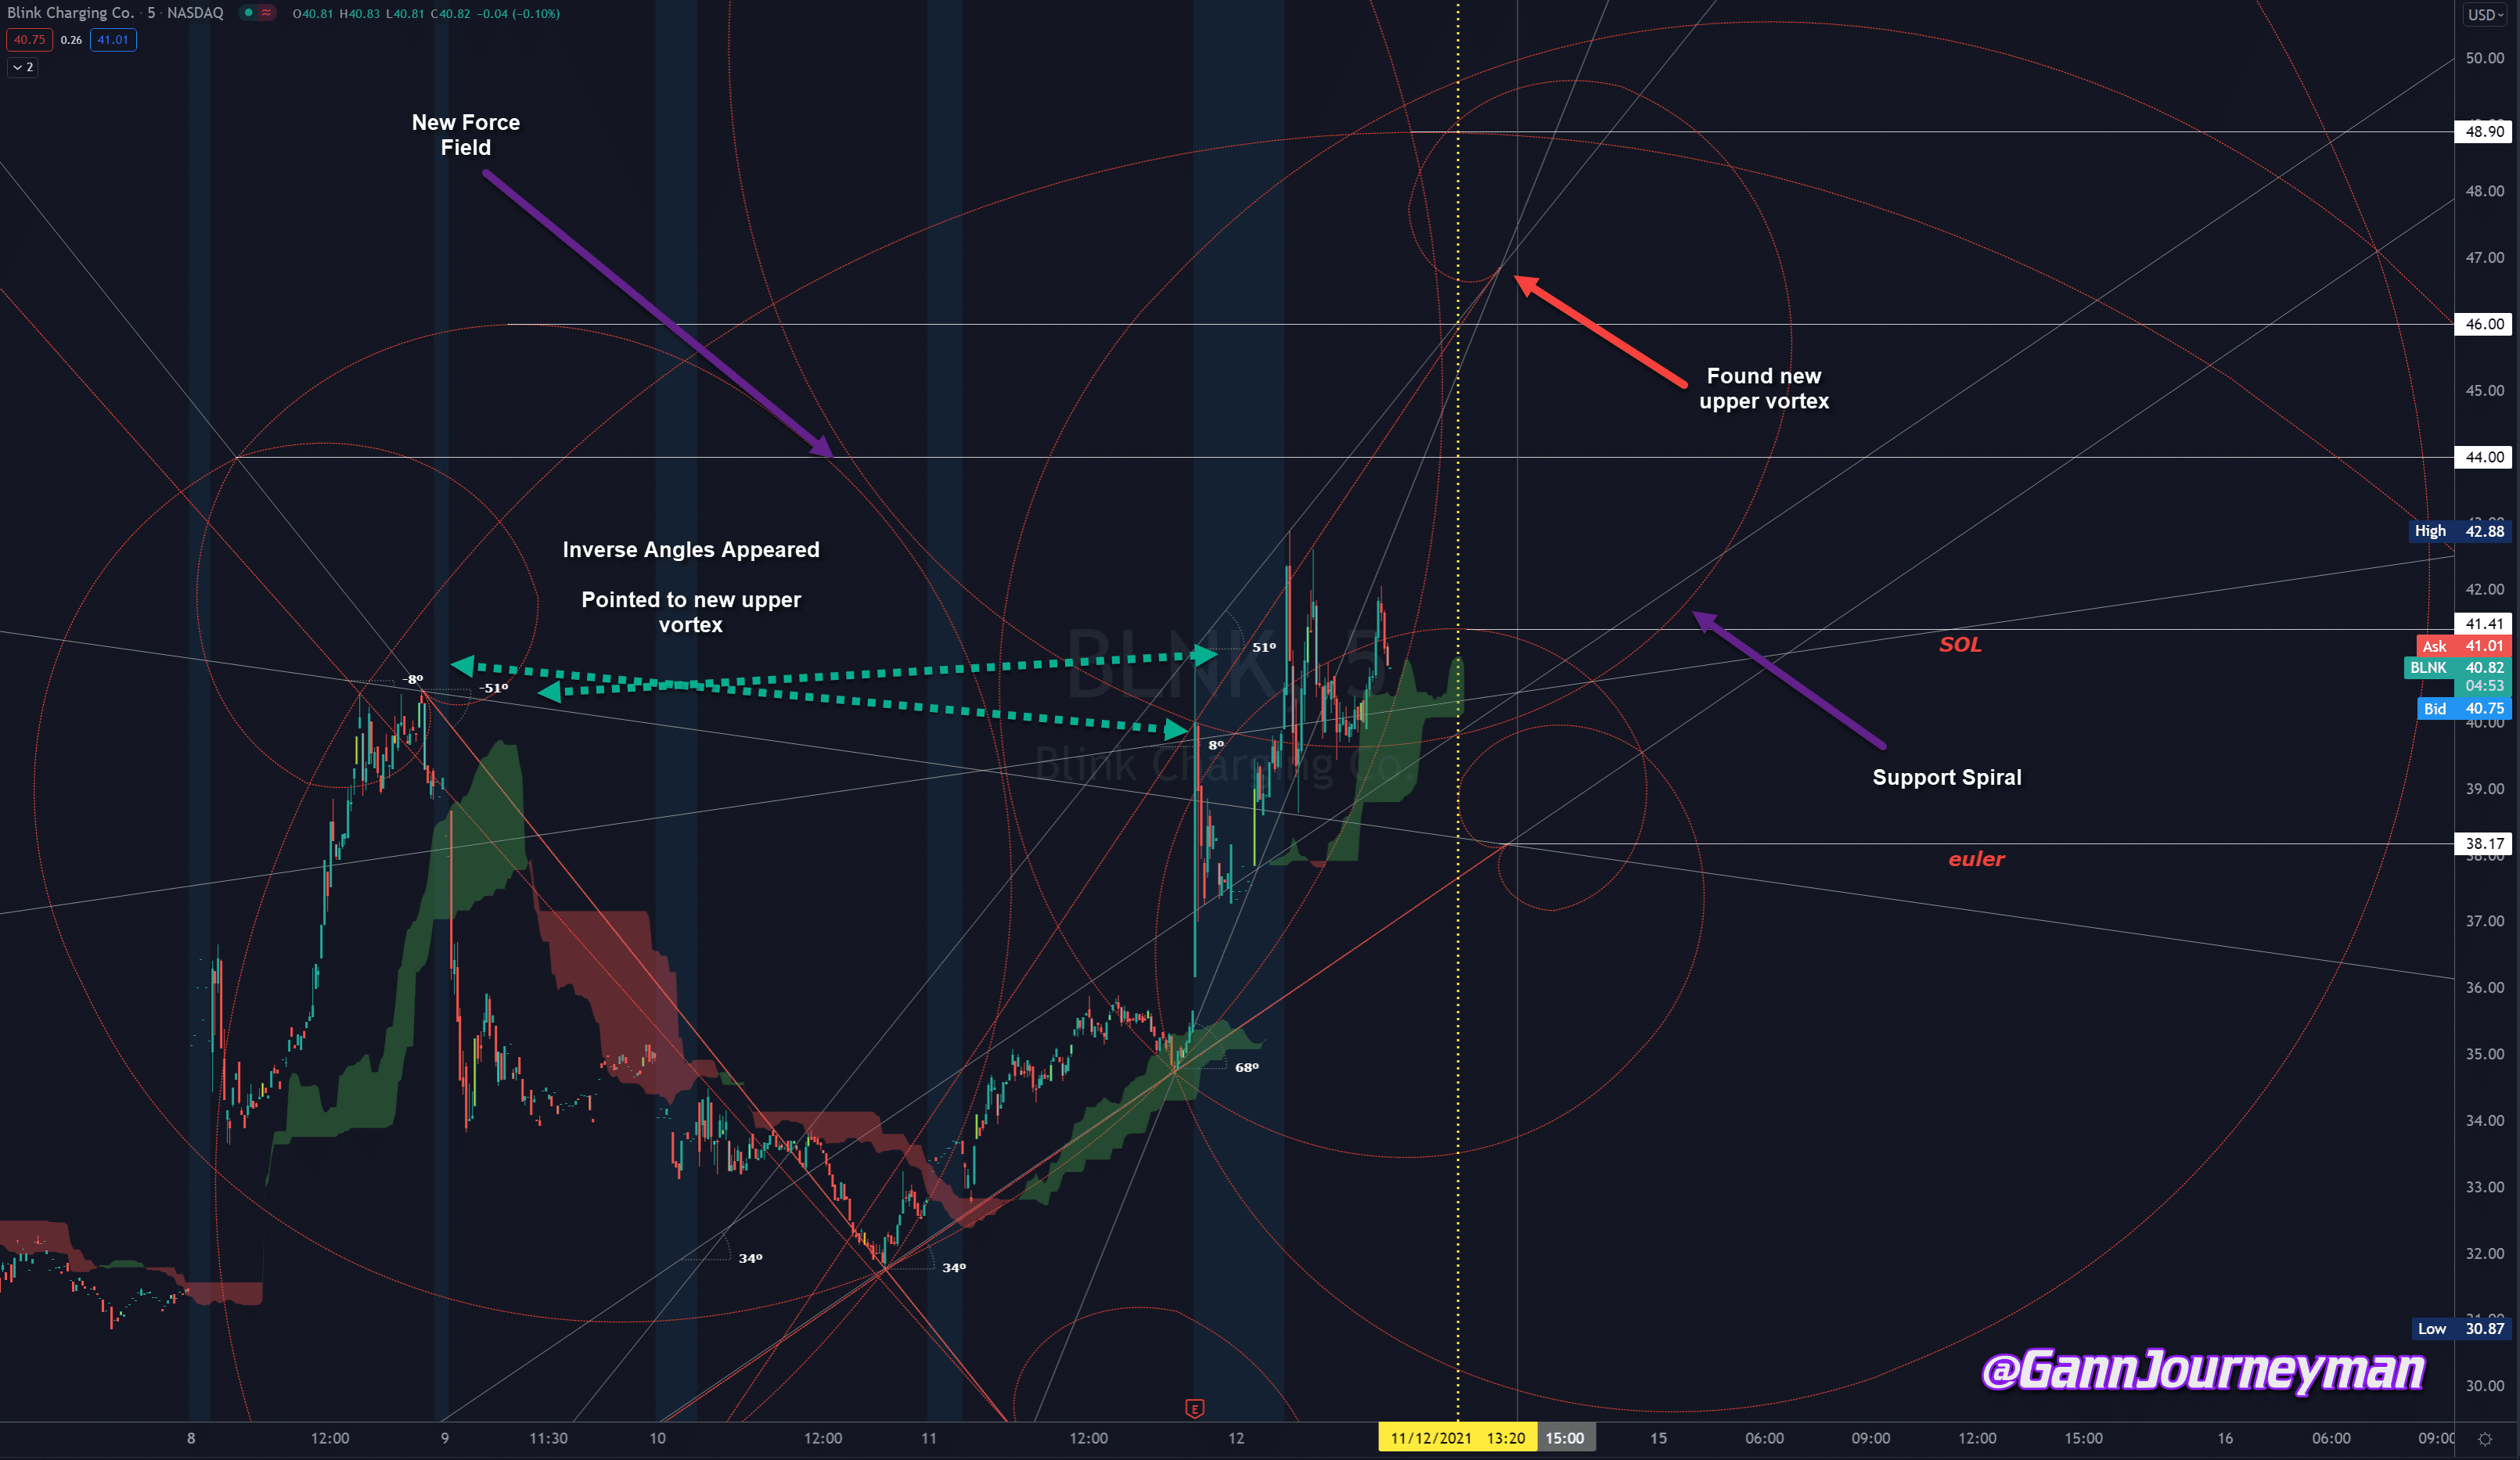
White horizontal lines are target points.
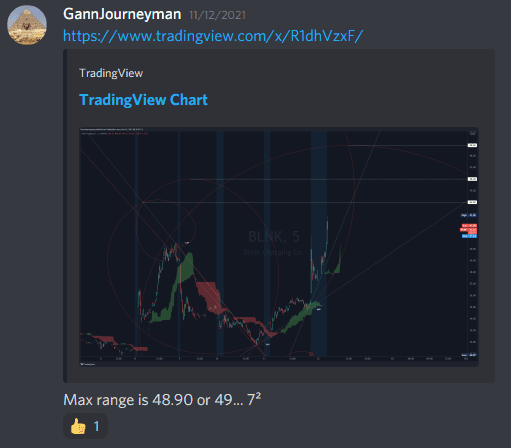
Chart created 11/12/2021

Initial thoughts on this chart
Found a new anchor point for a chart update.
Updated perspective at the time.
Price needs to exit that current fib spiral or it’s going to get sucked to that Euler vortex point. The trend line /spiral squeeze is about an hour from now.

Updated thoughts: Expecting some kind of reaction when we hit that yellow vertical

Found some new information and updated the chart.

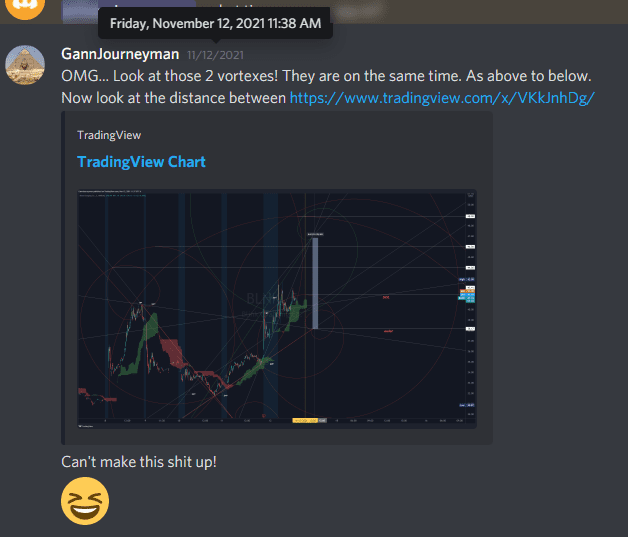
Started measuring and found some connections…
OMG… Look at those 2 vortexes! They are on the same time. As above to below. Now look at the distance between. Can’t make this shit up!
Dig deeper…

What do you see?
What I see…
vortex 46.86
46 / 64 8 squared
86 phi variant
distance between vortexs 8.86
percentage is even euler
bottom vortex is euler
Tell me this is RANDOM
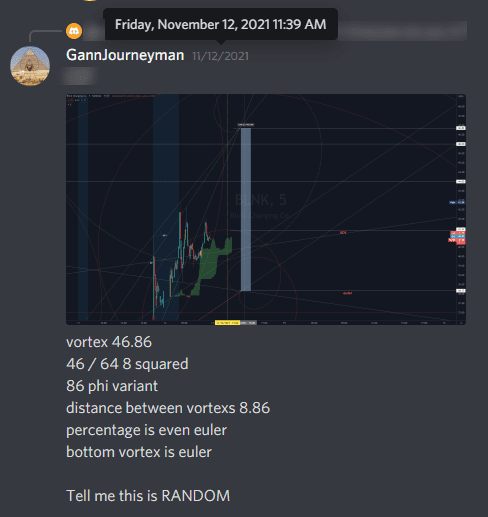
Chart Update
Chart progressing
Next chart update

Updated thoughts: Price settled between force fields. Squeeze move likely
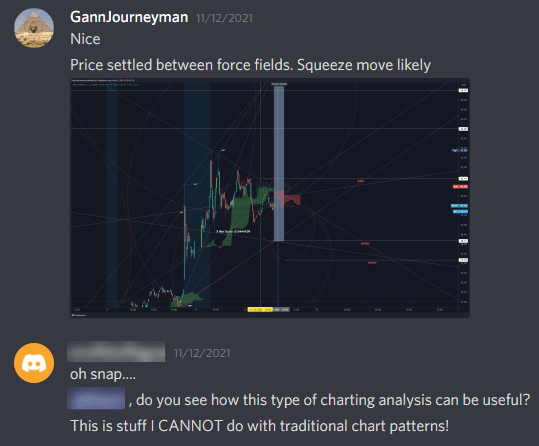
Chart Update


Seems random still?
Coincidence?
Believe what you want, but there are no coincidences, and it’s impossible to be random.
Last chart update…
