

If you would rather watch a video instead of read, see below.
Getting Started
What I want to share with you today is something that I’ve been using and playing with called Fibonacci Resistance Arcs and they’ve been working really well.
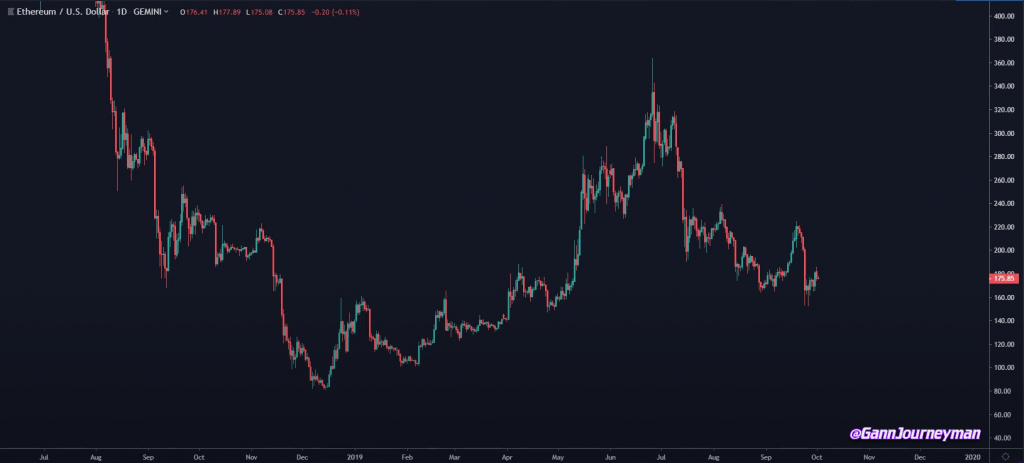
First off, I’m working on the Ethereum/ US Dollar 1 Day Gemini exchange chart and I’ve already squared my chart. So the first thing I want to do is start pulling from the last leg or the big move. In that case, it was this run-up here from $80 all the way up to about $360. I am just telling you the range I am working with. We will need to be more specific going forward.
Beware that after you lay the Fibonacci arcs, sometimes TradingView doesn’t play nice.
My Process
First thing I want to do is start laying down some guiding lines if you will.
I’m going to run my trend line here from the bottom $80.83 to $363.85. It’s going to be very important to make sure you get these as accurate as possible because you’ll need this whenever you’re laying your circles and Fibonacci resistance arcs.
I’m also going to draw some vertical lines as well to mark off the dates of the moves.
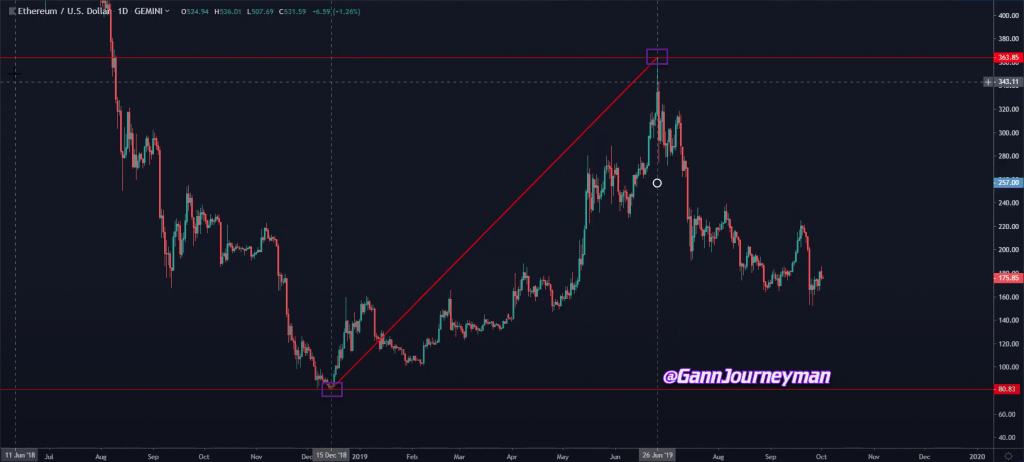
Now I want to know where the midpoint of the move is at. You can do the math, or use the Fib retracement tool.
I’m going to pull a Fib retracement here. Come from the low, hit to the high. I am looking for the .5 on the fib or the 50% mark. That comes out to $222.34
I will drop a horizontal line there and make sure we got it placed accurately.

Now we have that intersection marked and we can go ahead and remove or hide the fib retracement tool. The choice is yours.
I’m going to put another vertical line at the midpoint to signify the center of the four quadrants.
Now we have a nice square box here from the low to the high!
Time to add the Fibonacci Speed Resistance Arcs tool!
So come from the midpoint here and we’re going to go straight down.
Basically, we want this box to contain the circle. What you might discover is that TradingView always has a little bit hanging over the box.

As you can see, prices moving very nicely along the channels here. The video shows it better.
This is the default settings of the Fib Resistance Arcs from TradingView by the way. Don’t worry, I’ll show you what I use, which I found to be pretty helpful.
Now let’s repeat this and pull the Fib Resistance Arc from the midpoint up now to the high price level. I typically set it and then go back and make sure that all the price levels are set accurately on the tool.
Make sure that the bar number you are on matches up as well.

As you can see here, we have a nice big bulls-eye, and the price went right around it to our high coming out. Kind of like a vortex. Price is whipping around the center or eye of the Fib Arc and weakens with strength the further it moves away from the eye.
Other Settings For Fibonacci Resistance Arcs
What I want to share with you is there are other numbers you can plug into the Fib Resistance Arcs that will give you different channels.
I have 4 different types of settings for the Fib Resistance Arc tool.
Speed of Light (SOL)
For more information on the value related to the speed of light, you can read the post here.
Anything with 144 or the variant of that number is related to the speed of light.
Here is a reference list of numbers that all relate to being 144 and from vortex math, they all resonate/vibrate back to 9
- 144
- 141
- 114
- 411
- 414
- 441
These numbers are different but still the same. Using this in the settings, you can see it creates the tiny little band channels too.
You can look at how the price is interacting with the SOL variant. What we are after though is the most touches on our arcs.
If you want to see the settings I use in TradingView, check out my article:
https://gannjourney.com/fibonacci-resistance-arcs-settings/
Φ Golden Ratio (Phi) φ
These settings have everything tied to 0.618
Anything with 618 or the variant of that number is related to Phi or the Golden Ratio.
Here is a reference list of numbers that all relate to being 618 and from vortex math, they all resonate/vibrate back to 6
- 0.618
- 0.168
- 0.186
- 0.681
- 0.816
- 0.861

If you want to see the settings I use in TradingView, check out my article:
https://gannjourney.com/fibonacci-resistance-arcs-settings/
Pi
These settings have everything tied to 0.314
Anything with 314 or the variant of that number is related to Pi.
Here is a reference list of numbers that all relate to being 314 and from vortex math, they all resonate/vibrate back to 8
- 0.314
- 0.134
- 0.143
- 0.341
- 0.413
- 0.431
If you want to see the settings I use in TradingView, check out my article:
https://gannjourney.com/fibonacci-resistance-arcs-settings/
Mirrors – Repeating Numbers
These settings have everything tied to repeating numbers. During some of my numerology studies, these master numbers kept appearing so I played around with this idea and it works out pretty well.
So I start with 0.111 and work my way up as high as the fields allow which capped off at 1.222
